Abstract
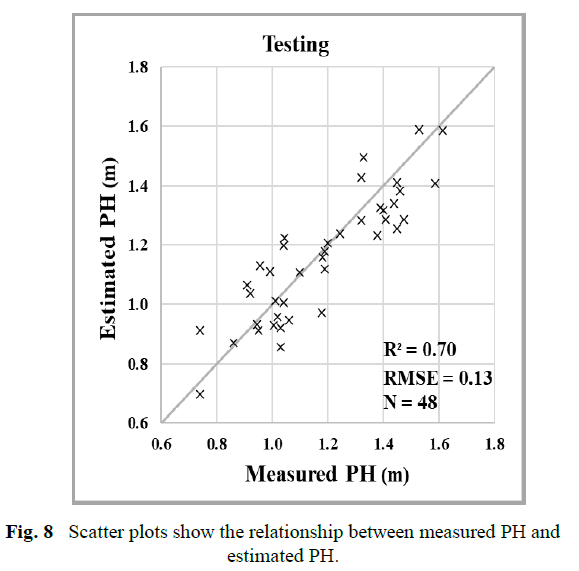
The study aims to estimation paddy rice plant height (PH) using UAV remote sensing for evaluation of the growth status of rice in fields. The study area is in Kantharawichai District, Maha Sarakham Province, Thailand. Modeling to estimate the plant height of rice from the correlation between height data from 120 sample field measurements, and reflectance data and digital elevation model (DEM) data was obtained by RGB camera-equipped UAVs, the camera has a resolution of 12 million pixels, the flight recorded an image at an altitude above the ground of 90 meters. and consider the photo data at ground sample distance (GSD) of 5 cm. Analyzed to modeling with a generalized linear model algorithm, the analysis data was divided into two parts for modeling and testing 60 and 40 percent replicas, respectively. The results show that the relationship between measured PH and estimated PH has R2 of 0.70 and RMSE of 0.13 meter. This study shows that the digital elevation model (DEM) from aerial photography with unmanned aerial vehicle, it is an important parameter in estimating the plant height of rice.
Research Story
Why Plant height?
- Plant height (PH)is one of the important agricultural parameters for assessing plant growth status.
- Plant height is widely used to evaluate above-ground biommass and effective grain yields.
- Plant height may be an indicator of the ability to retain nutrients of a useful carbohydrate type.
- Plant height is something that reflects the change in growth over time.
How we measured Plant height?
- Basically, plant heights are measured manually.
- Select representatives of a few plants per plot to show overall plant height status.
Shortages:
- Manually measure PH in the field requires a lot of labor or time.
- Access may be restricted for plants in large area plots.
Possible technology?
Unmanned aerial long-range survey (UAV) technology is one that can digital elevation model from a photo, surveying with a UAV can overcome time constraints, manpower, investment cost and provide high-profile information in large areas.
Study Area:
Kantharawichai District, Maha Sarakham Province, Thailand.
Study Plan:
- Estimate the plant height of rice with:
- Reflectance derived value.
- Digital elevation model (DEM) from RGB images(ground sample distance: 5cm).
- Analysis with generalized linear model algorithm.
- Assess the statistical reliability of the model with the coefficient of determination (R^2) and the root mean square error (RMSE).
Materials and Methods
Study Period
July to November of 2019.(Sowing of rice grain was done by the end July 2019.)
Image Acquisition
Device: Phantom 3 Advanced(RGB camera’s resolution: 12 million pixels)
Flight altitude: 90m
Front-overlap: 80%
Side-overlap: 60%
Ground control points(GCP): 8
Flight schedule
- Tillering stage(2 times)
- Panicle initation stage(3 times)
- Flowering stage(4 times)
- Milky and dough stage(5 times)
- Harvest maturity stage(6 times)
Total: 20 times
Samples’ select: Samples were randomly collected in the experimental rice plot, 20 samples were collected at a time for six times, totaling 120 samples.
Field measuring: The rice that was dug up was measured the height from the root to the tip of the leaf. And use a tool called RTK GNSS to collect the coordinates of the sampling point, ground control points (GCP) and ground level values.
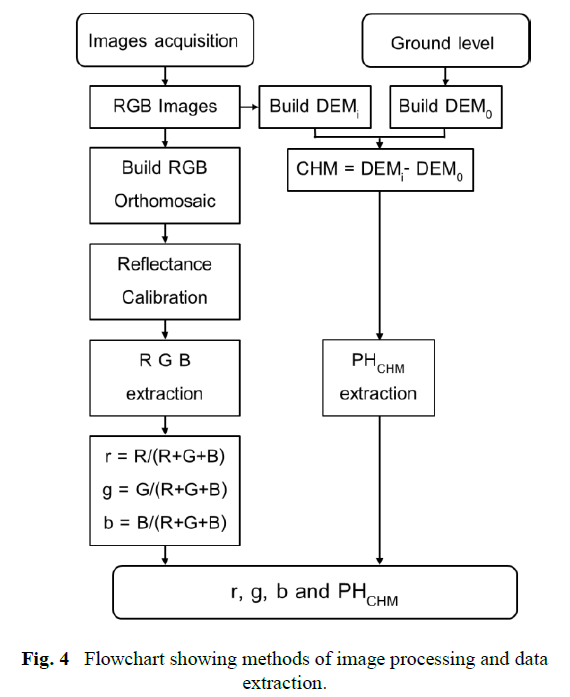
Image Processing
- Adjust the reflectivity to be in the standard form.
- R = R / (R+G+B)
- G = G / (R+G+B)
- B = B / (R+G+B)
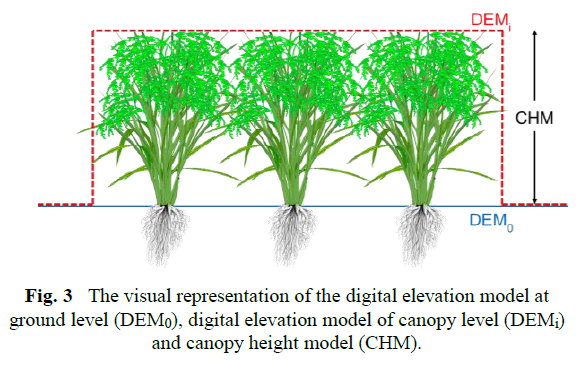
- The digital elevation models at ground level: DEM0
- Canopy level (DEMi)
- The canopy height model (CHM) = DEMi - DEM0
- Image processing and data extraction can be easily explained as shown in Fig. 4.
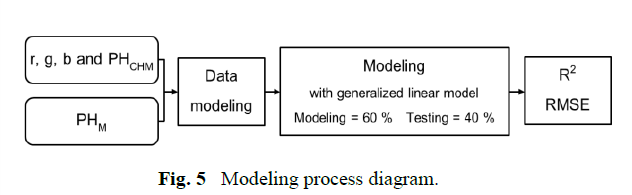
Modeling
The data were divided into two groups:
- 60 % (N=72) for modeling data sets
- 40% (N=48) for testing data sets.
Result
Generalized linear model:
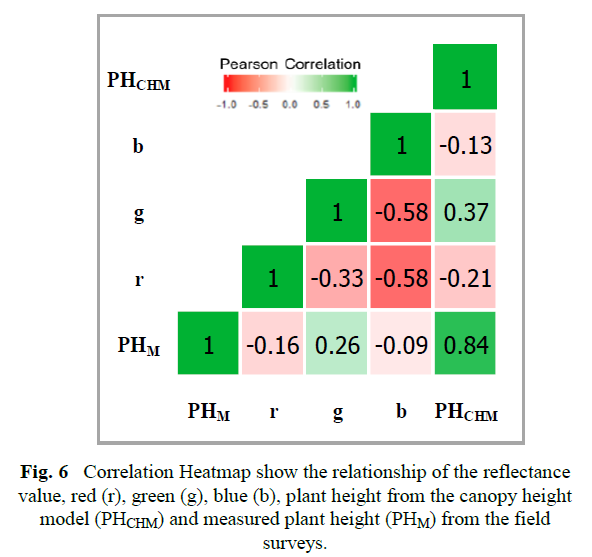
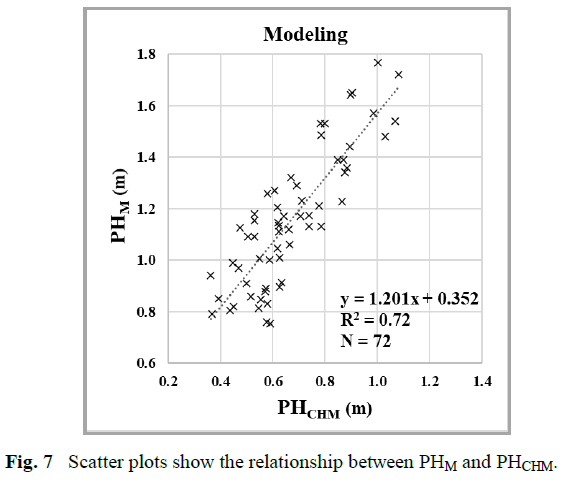
It was found that PHM was the most correlated with PHCHM, the correlation coefficient of 0.84.
Evaluation
- Scatter plots show the relationship between PHM and PHCHM.
- Result in Testing set
Discussion
This study shows that the digital elevation model (DEM) from aerial photography with unmanned aerial vehicle, it is an important parameter in estimating the plant height of rice.
–end